Coastal artefacts in the Mapzen DEM
The Mapzen DEM is a global elevation model that includes bathymetry (water depth). But in many places (especially where there is steep coastline) there are errors where the land and water elevation models were merged.
These show up as areas that are offshore but are recorded as dozens of metres above sea level.
Land elevation isn’t impacted.
But if using Mapzen foreshore bathymetry, or negative elevations to identify coastline, consider using an alternate DEM (the Copernicus DEM comes with a water mask!) or a polyline.
Heatmaps
This clipped heatmap of Wellington Harbour is a good representative summary of the situation: spurious above-sea-level blobs. The white (0 elevation) band near the coastline shows that the land elevation is correct at least.
Aerial imagery is from Mapbox.
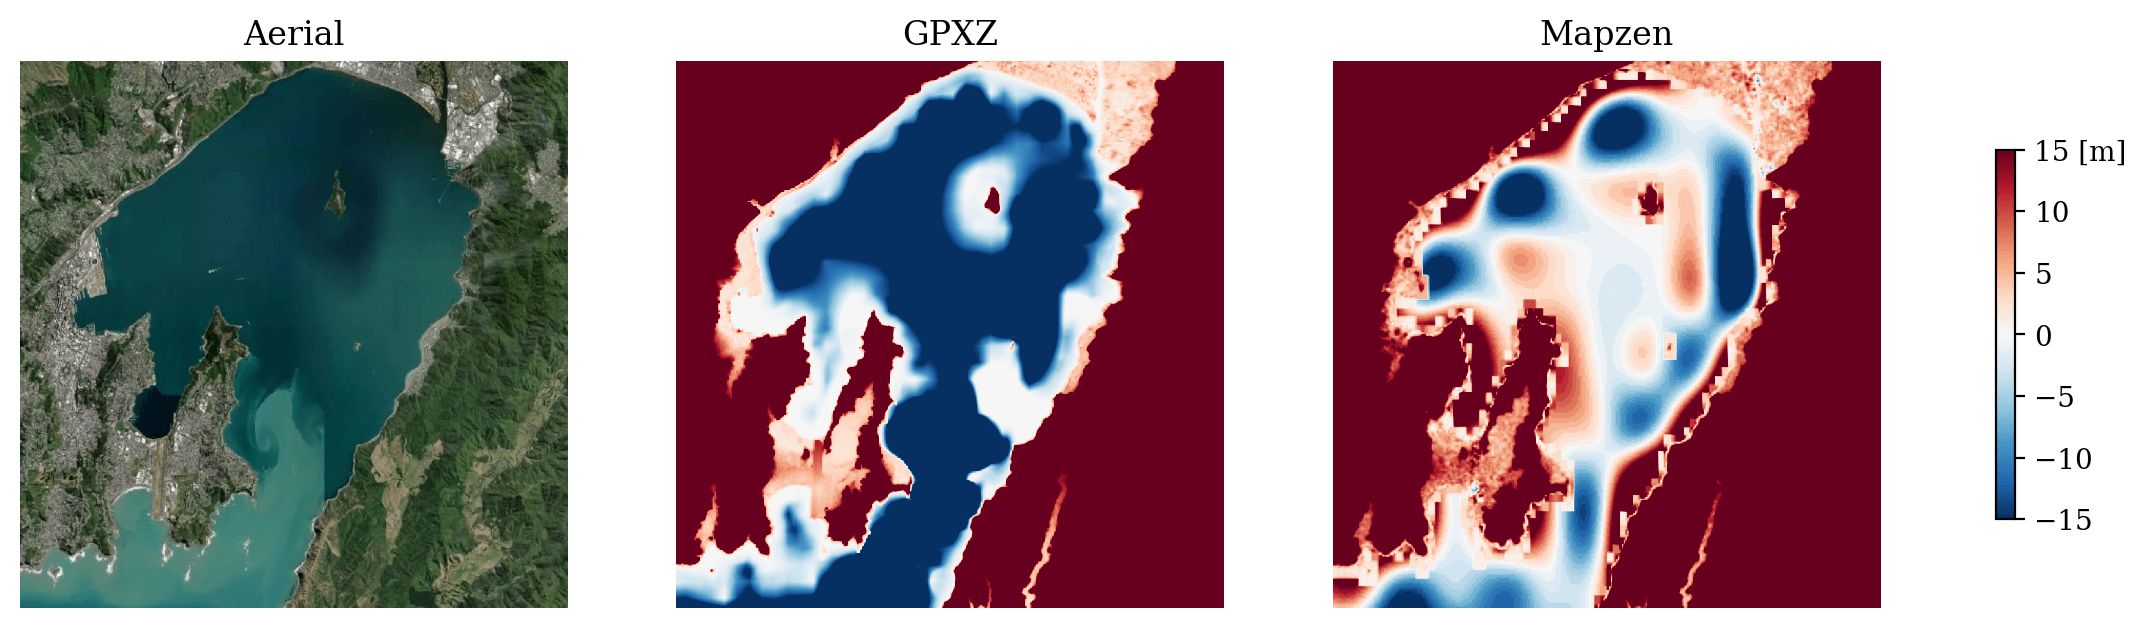 Elevation above mean sea level. GPXZ data is from LINZ, Copernicus and GEBCO. 7.5km square centred on -41.2909,174.8511 (Wellington, NZ).
Same situation in the coves of Bank’s Peninsula. The Northern coastline, where the inland profile is much flatter, doesn’t suffer from the artefact issue.
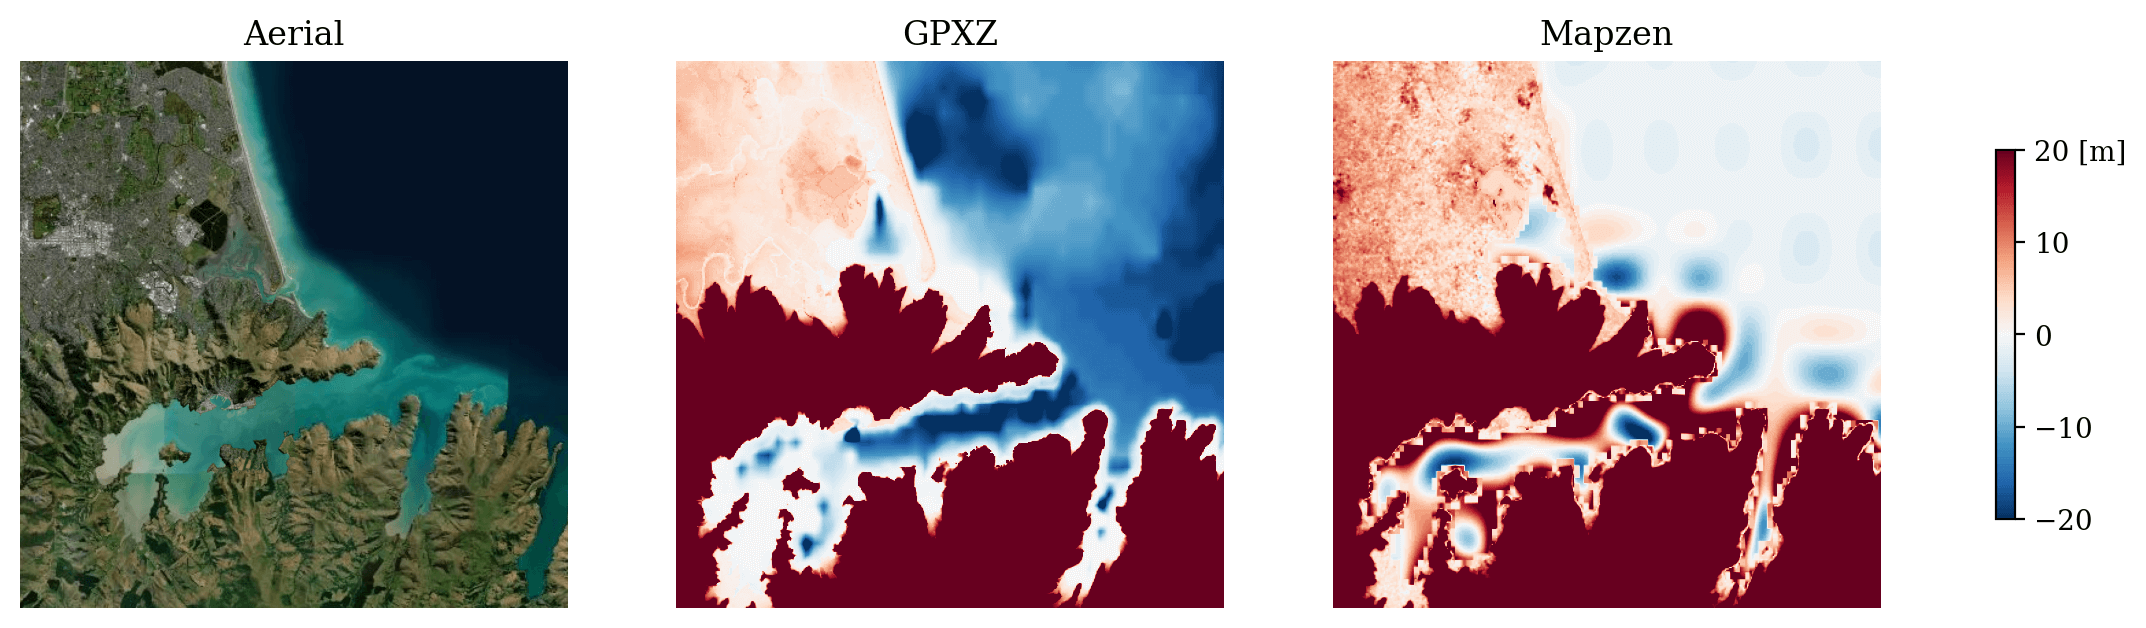 Elevation above mean sea level. GPXZ data is from LINZ and GEBCO. 10km square centred on -43.5789,172.7593 (Canterbury, NZ).
A closeup of the above image shows that the coastline is a local minima, with elevation increasing just offshore. Far out to sea, the bathymetry is fine.
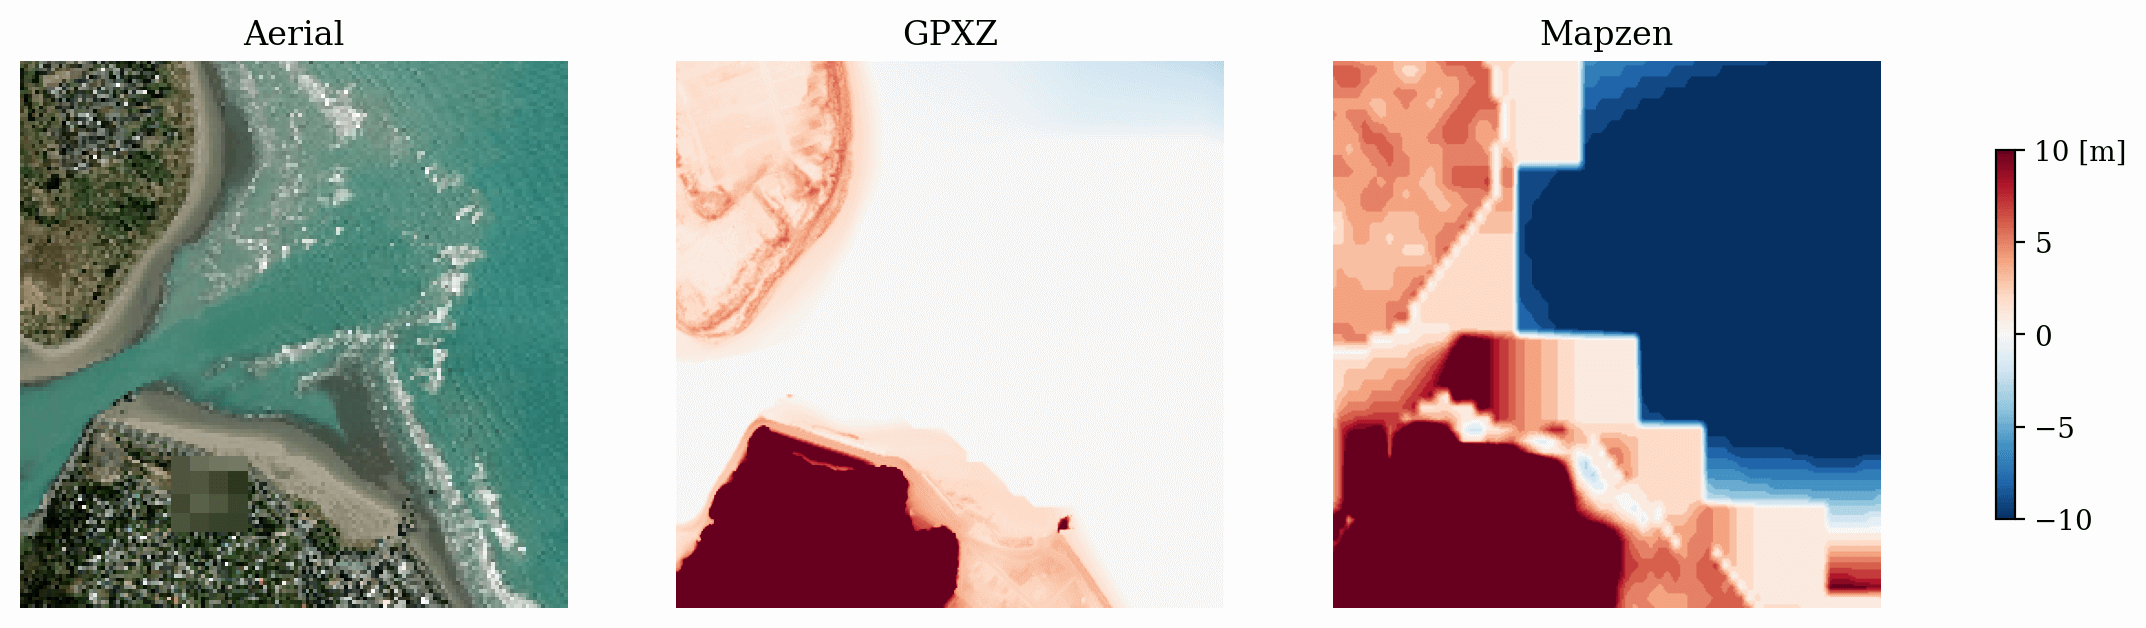 Elevation above mean sea level. GPXZ data is from LINZ and GEBCO. 750m square centred on -43.5615,172.7560 (Sumner, NZ).
In this region in Norway, the water depth within a 30m Mapzen pixel of land is fine, but issues occur when the bathymetry kicks in.
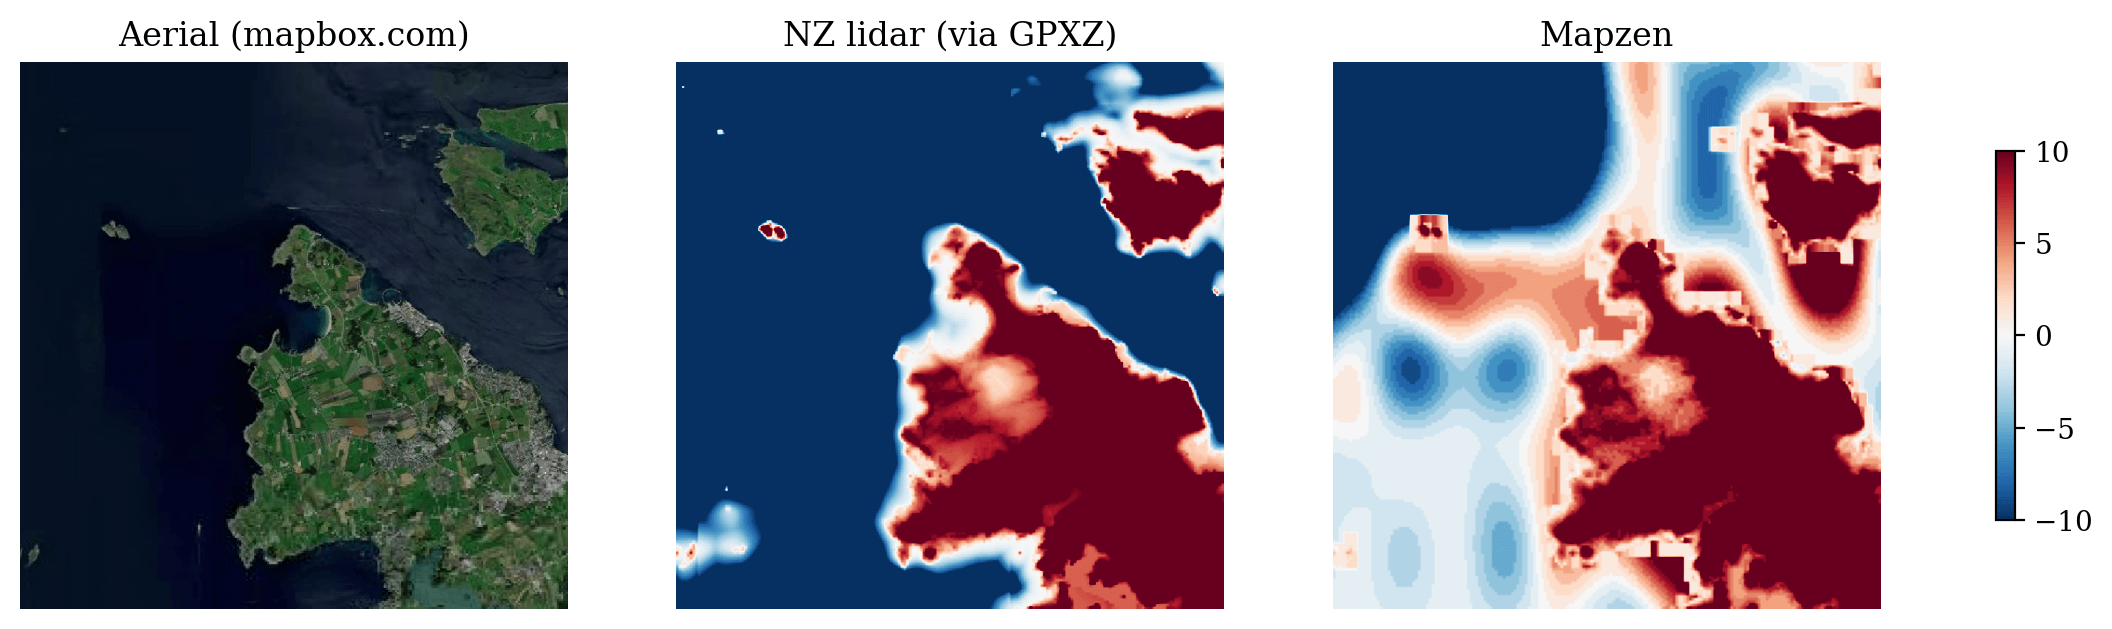 Elevation above mean sea level. GPXZ data is from Kartverket and EMOD. 5km square centred on 59.0186,5.5806 (Stavanger, Norway)
Almost all of Hong Kong is impacted.
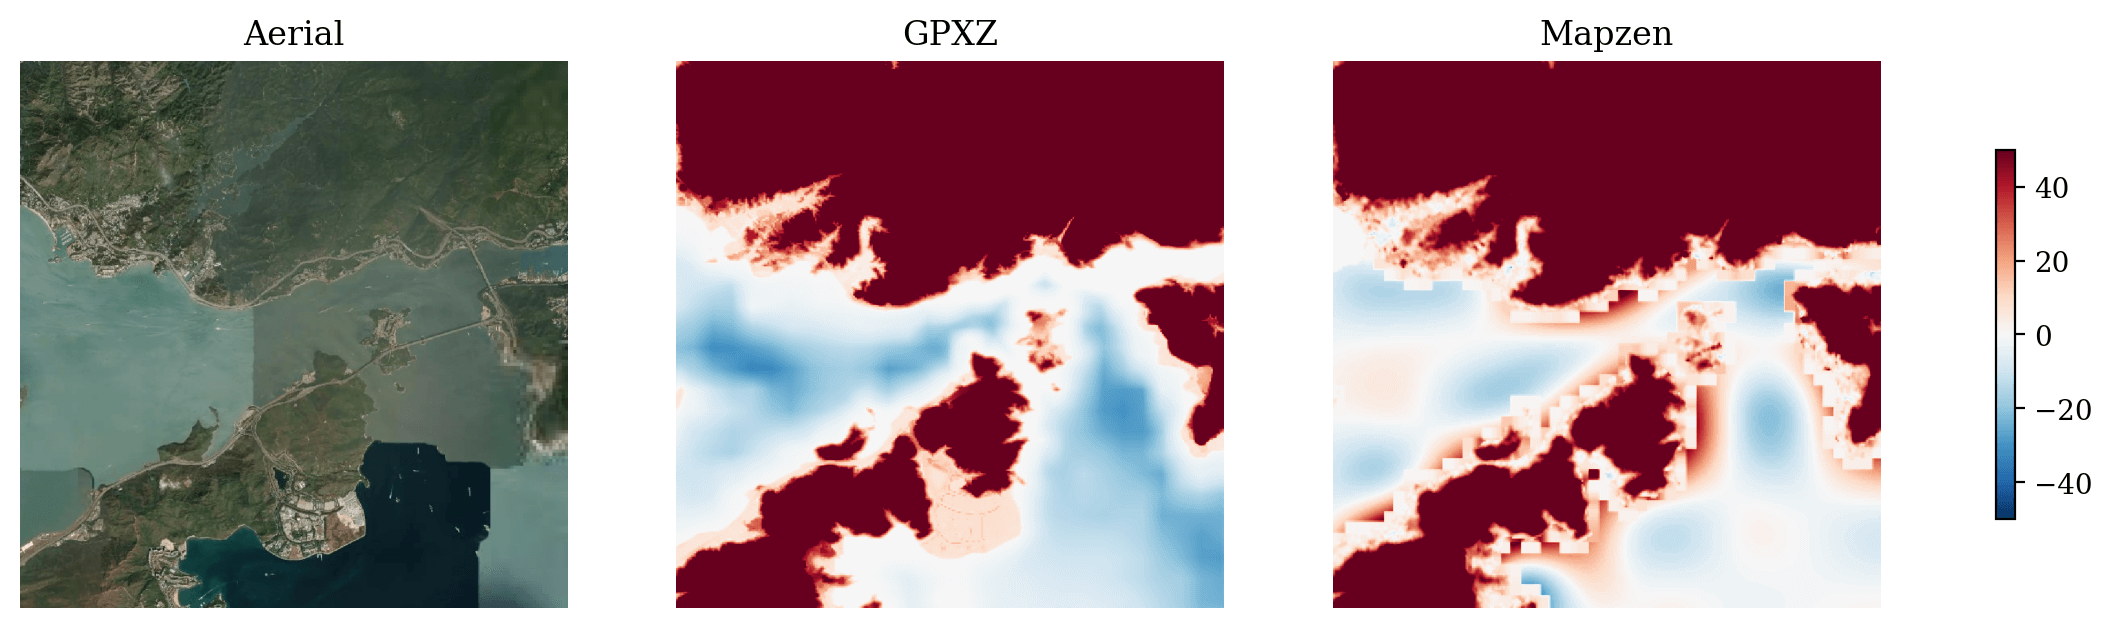 Elevation above mean sea level. GPXZ data is from HK Geodata and GEBCO. 6km square centred on 22.3507,114.0402 (Hong Kong).
Accurate foreshore bathymetry
GPXZ is an API for high-resolution elevation data. As shown in the heatmaps above, we carefully merge bathymetry and high-resolution lidar data to result in smooth coastal transitions.
If you need DEMs or help processing them, get in touch at [email protected]!