Using rayshader in Python
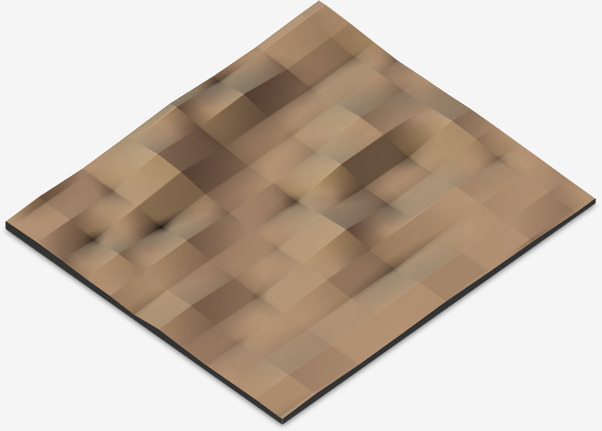
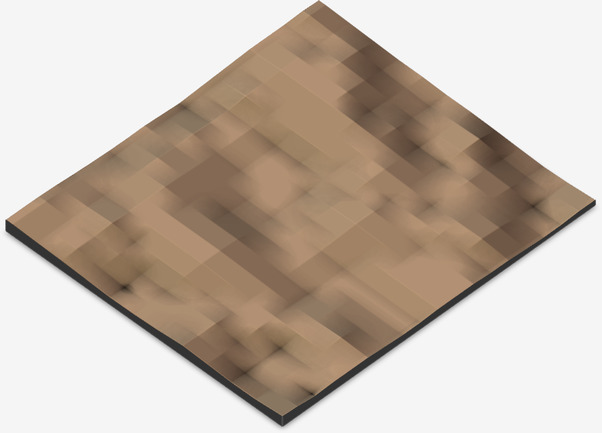
rayshader is an amazing R package for producing realistic 3D maps from elevation data. The maps produced by rayshader are much easier to interpret than 2D hillshaded or heatmap images, plus they’re just really cool to look at.
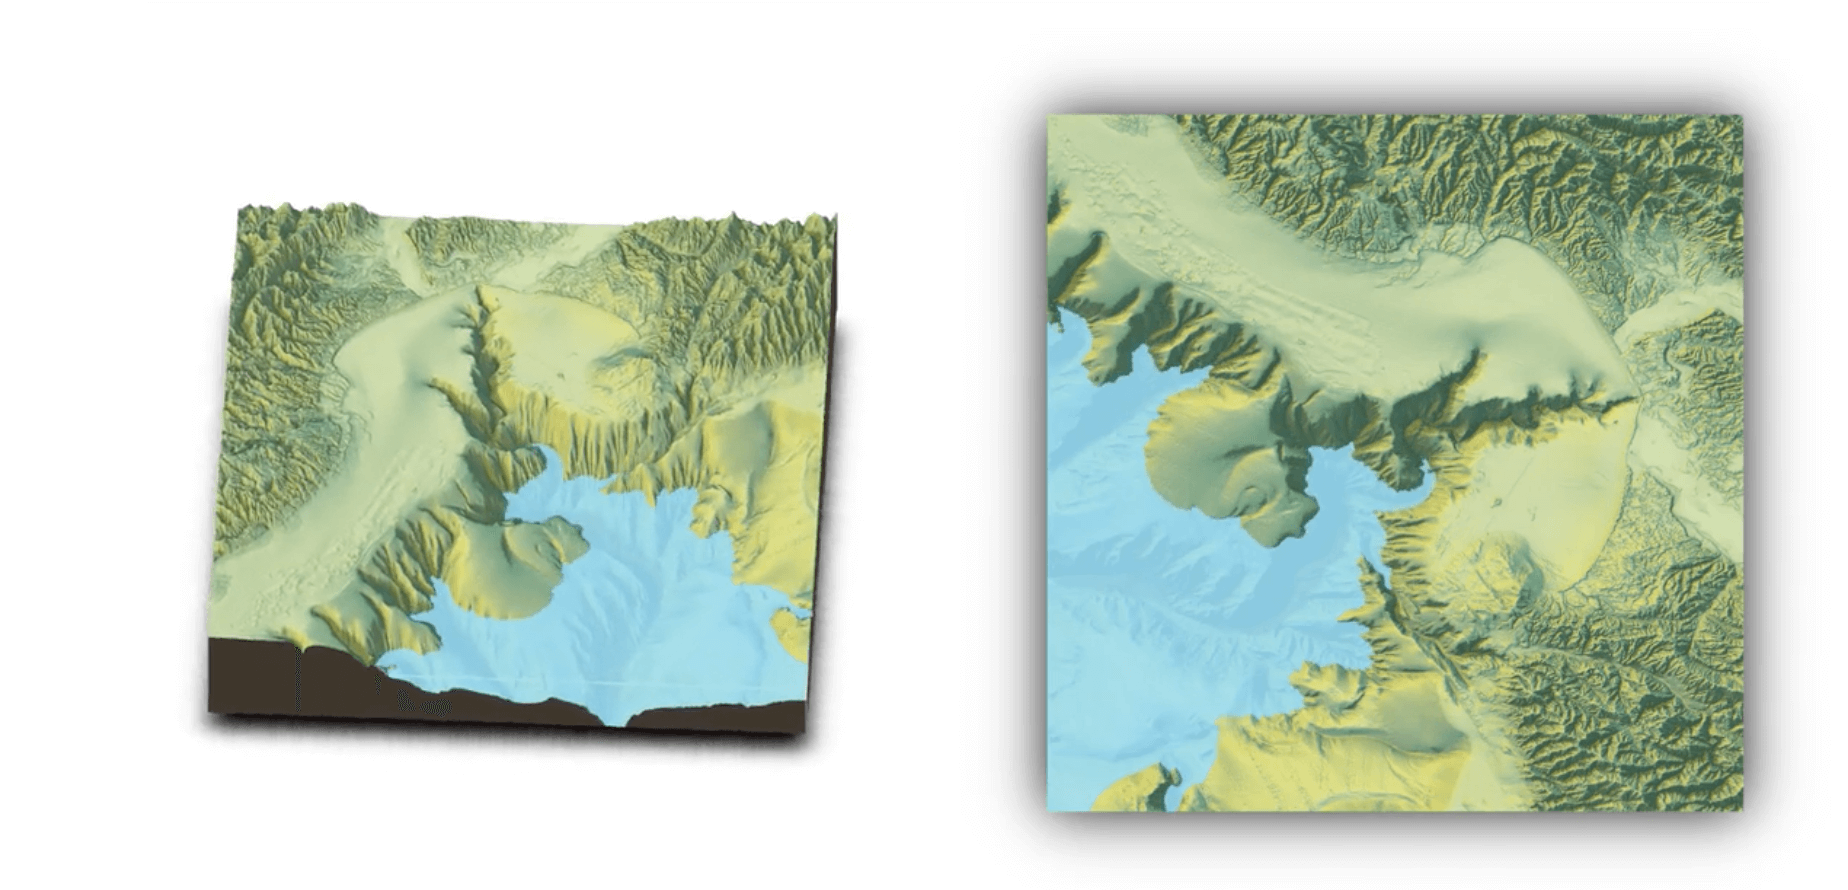 From rayshader.com
Here at GPXZ we do our geospatial analysis in Python, but the rayshader package is only available for R and there’s nothing similar for Python. Fortunately it’s possible to call rayshader from Python using rpy2.
Installation
You’ll need to have rpy2 installed
pip install rpy2
and will also need to have rayshader installed in R
install.packages("devtools")
devtools::install_github("tylermorganwall/rayshader")
Usage
We’ll need to import some standard python geospatial packages, import rpy2, and activate rpy2’s numpy translation layer.
import tempfile

import matplotlib.pyplot as plt
import numpy as np
import rasterio as rio
import rpy2.robjects as ro
import rpy2.robjects.numpy2ri
import rpy2.robjects.packages as rpackages

rpy2.robjects.numpy2ri.activate()
I’ll load the same raster used in the rayshader.com getting started example into a 2D numpy array.
zip_url = '/vsizip//vsicurl/https://tylermw.com/data/dem_01.tif.zip/dem_01.tif'
with rio.open(zip_url) as f:
    z = f.read(1)

plt.imshow(z)
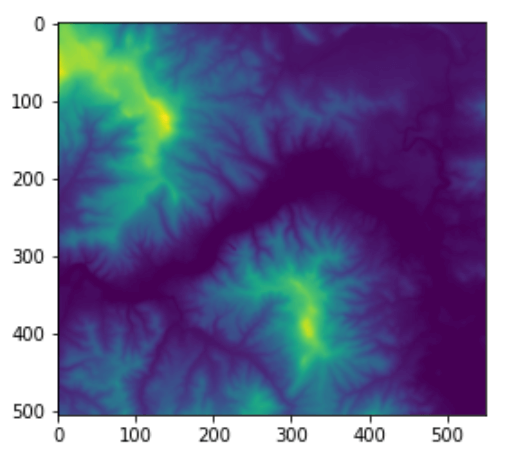
The resulting heatmap gives shows the elevation profile, but isn’t super intuitive. That’s where rayshader steps in.
rpy2 has a number of different interfaces, but the easiest thing was to load all the variables into the r namespace, then call the R code as a string.
def rayshade(z, img_path=None, zscale=10, fov=0, theta=135, zoom=0.75, phi=45, windowsize=(1000, 1000)):

    # Output path.
    if not img_path:
        img_path = tempfile.NamedTemporaryFile(suffix='.png').name

    # Import needed packages.
    rayshader = rpackages.importr('rayshader')

    # Convert array to matrix.
    z = np.asarray(z)
    rows, cols = z.shape
    z_mat = ro.r.matrix(z, nrow=rows, ncol=cols)
    ro.globalenv['elmat'] = z_mat

    # Save python state to r.
    ro.globalenv['img_path'] = img_path
    ro.globalenv['zscale'] = zscale
    ro.globalenv['fov'] = fov
    ro.globalenv['theta'] = theta
    ro.globalenv['zoom'] = zoom
    ro.globalenv['phi'] = phi
    ro.globalenv['windowsize'] = ro.IntVector(windowsize)

    # Do the render.
    ro.r('''
        elmat %>%
          sphere_shade(texture = "desert") %>%
          add_water(detect_water(elmat), color = "desert") %>%
          add_shadow(ray_shade(elmat, zscale = 3), 0.5) %>%
          add_shadow(ambient_shade(elmat), 0) %>%
          plot_3d(elmat, zscale = zscale, fov = fov, theta = theta, zoom = zoom, phi = phi, windowsize = windowsize)
        Sys.sleep(0.2)
        render_snapshot(img_path)
    ''')

    # Return path.
    return img_path
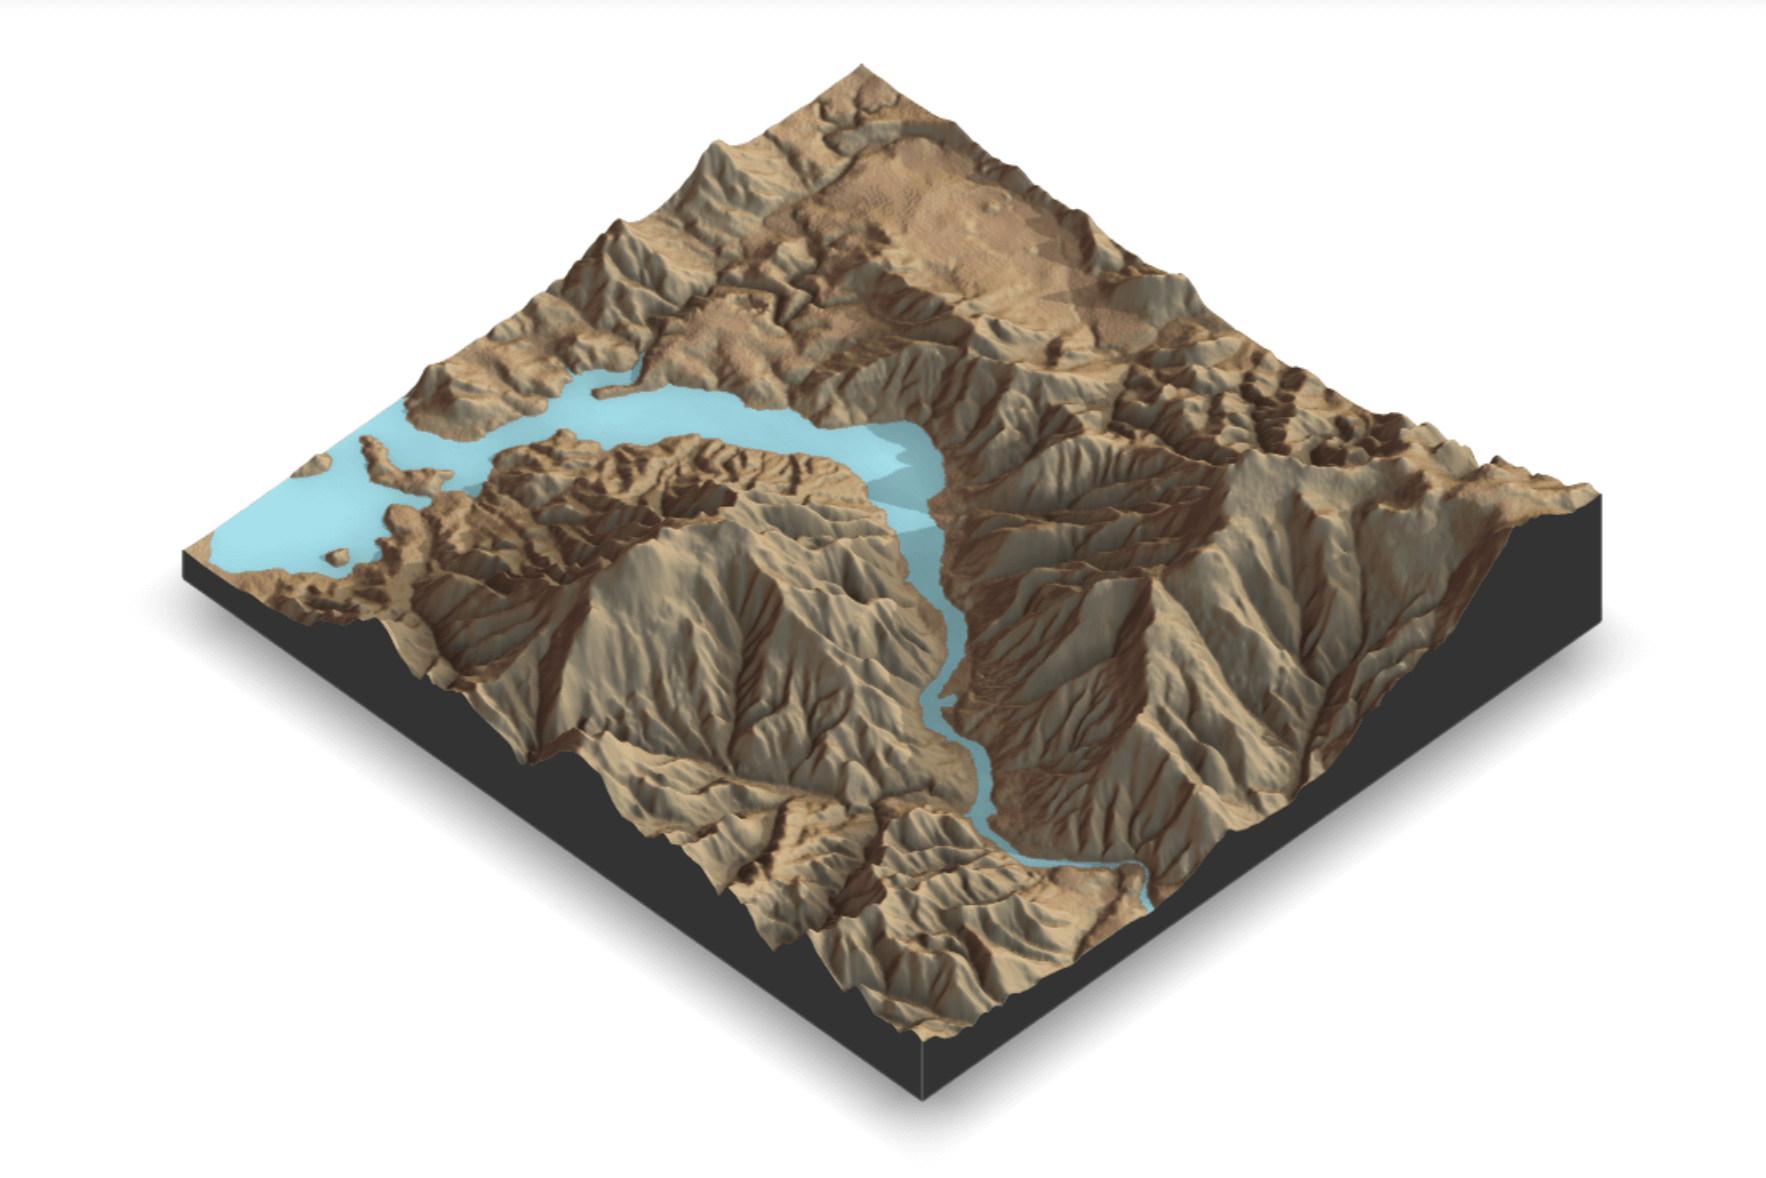
This function returns the path to a rendered 3D png. From there you could copy the file or display it in a jupyter notebook.
img_path = rayshade(z)

from IPython.display import Image
Image(filename=img_path)
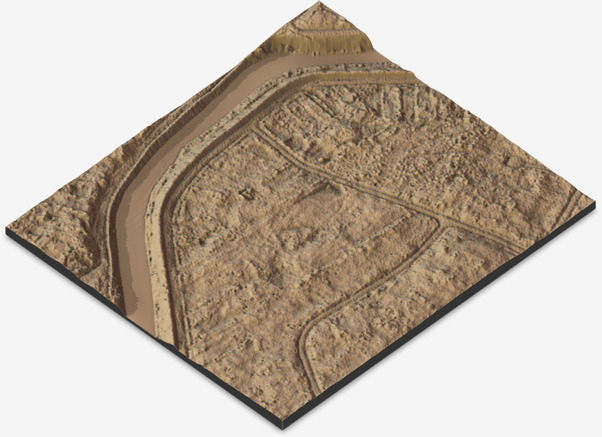
Rayshading at GPXZ
GPXZ is an API for high-resolution elevation data. We’re constantly running experiments to improve our data quality, and use rayshader (via python!) to visualise the results.
If you need elevation data or help processing it, get in touch at [email protected]!