Aligning rasters for inspection
I previously wrote about interpolating multiple rasters into arrays with the same shape and extent:
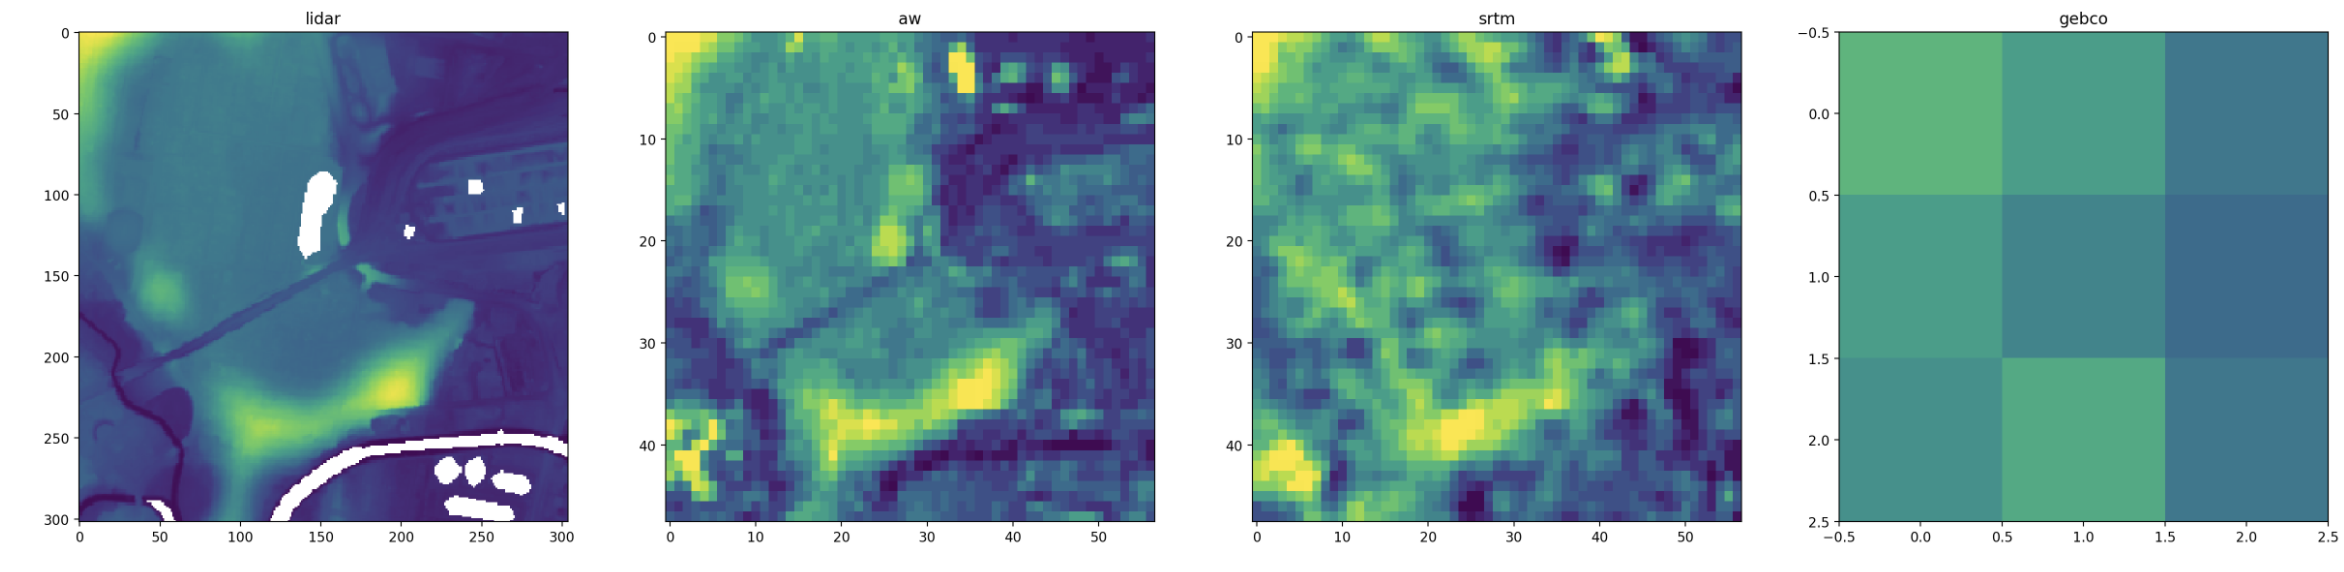
This is useful for analysis. However, the interpolation and reprojection modifies the actual raster data which can obscure small-scale issues and flatten peaks and troughs. Single-pixel spikes are not uncommon in DEMs (here’s and example in the Mapzen dataset), and to visualise this noise I need to compare the actual pixel values for multiple datasets.
One way to do this is to still transform all the rasters to a common shape and projection, but use nearest-neighbour interpolation and an oversampled resolution:
This oversampling approach has the advantage of aligning the extent of the rasters, which is especially helpful for rotated projections. But oversampling can give jagged pixel squares, and requires a lot of memory (especially when working with rasters that have slightly different resolutions or projections: you have to oversample by a lot to find a common denominator.)
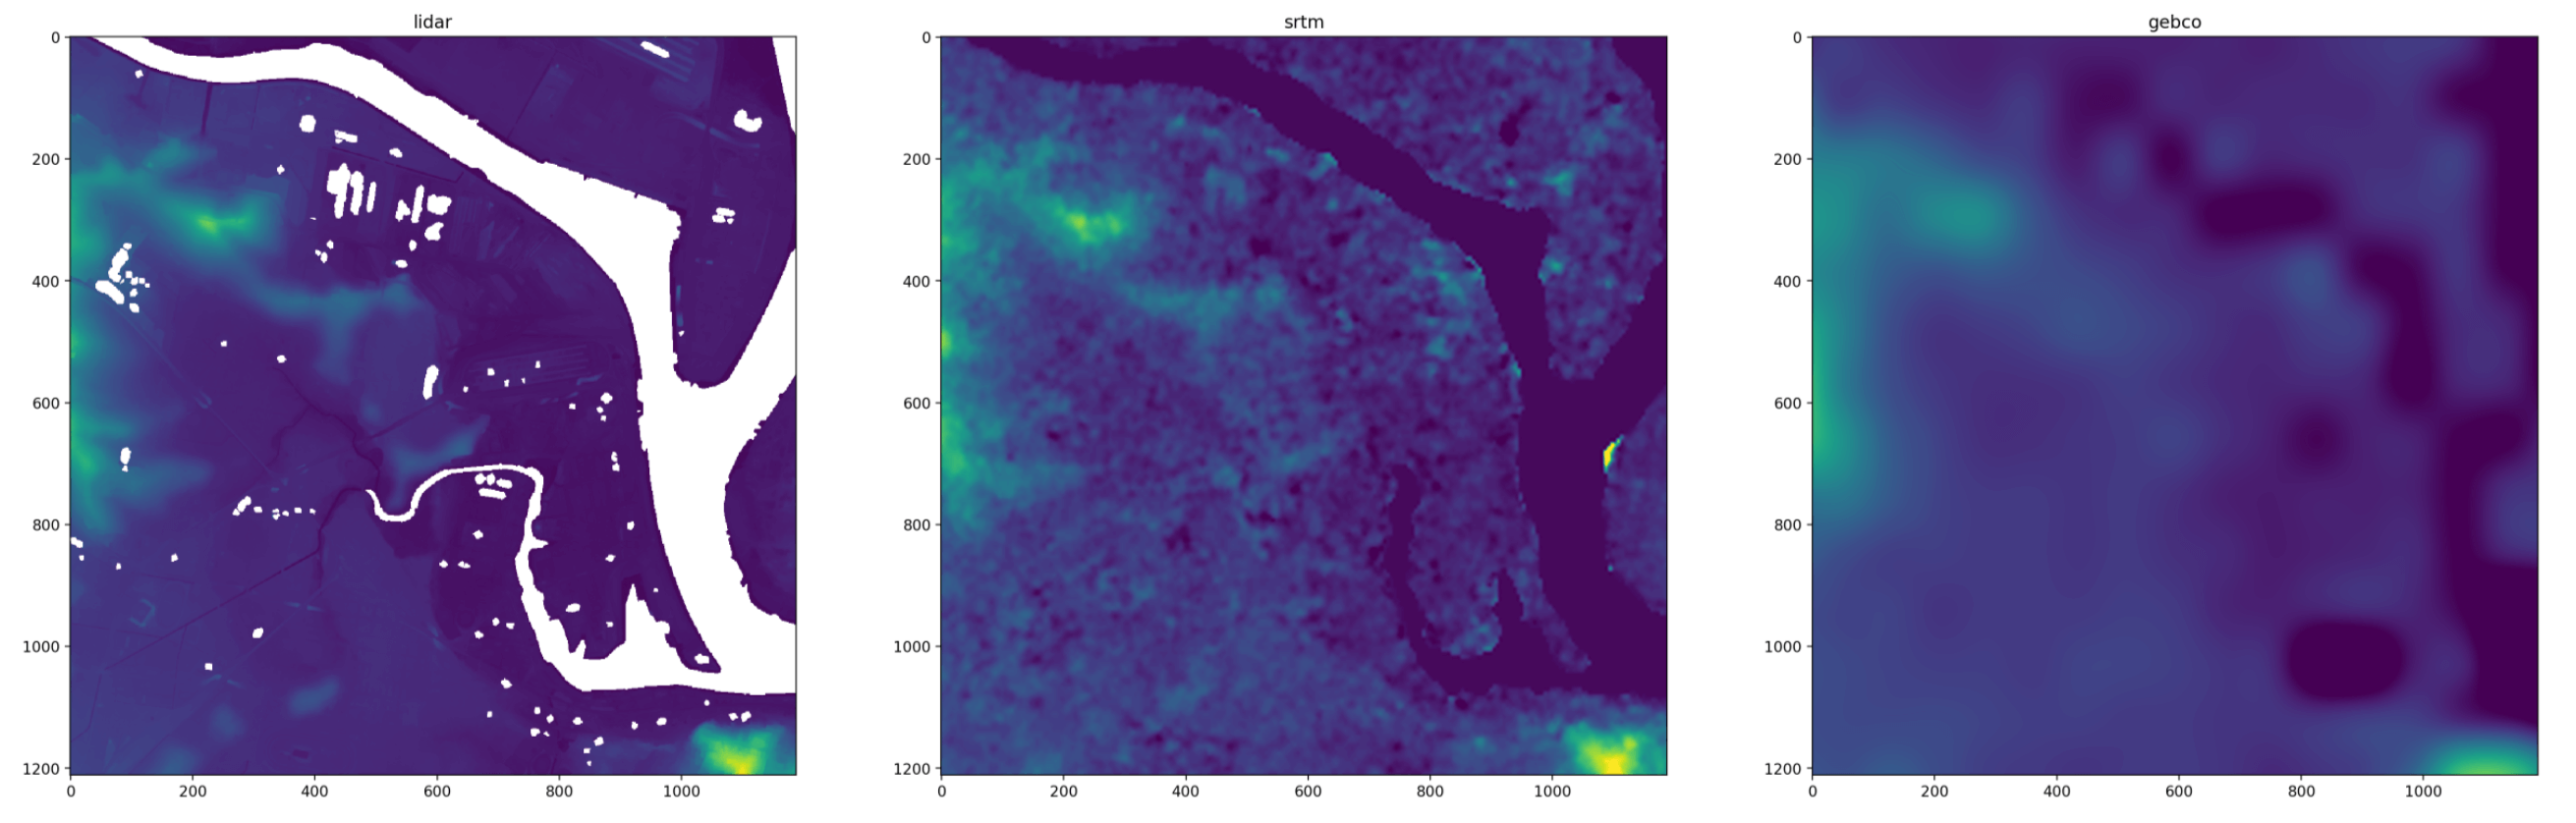
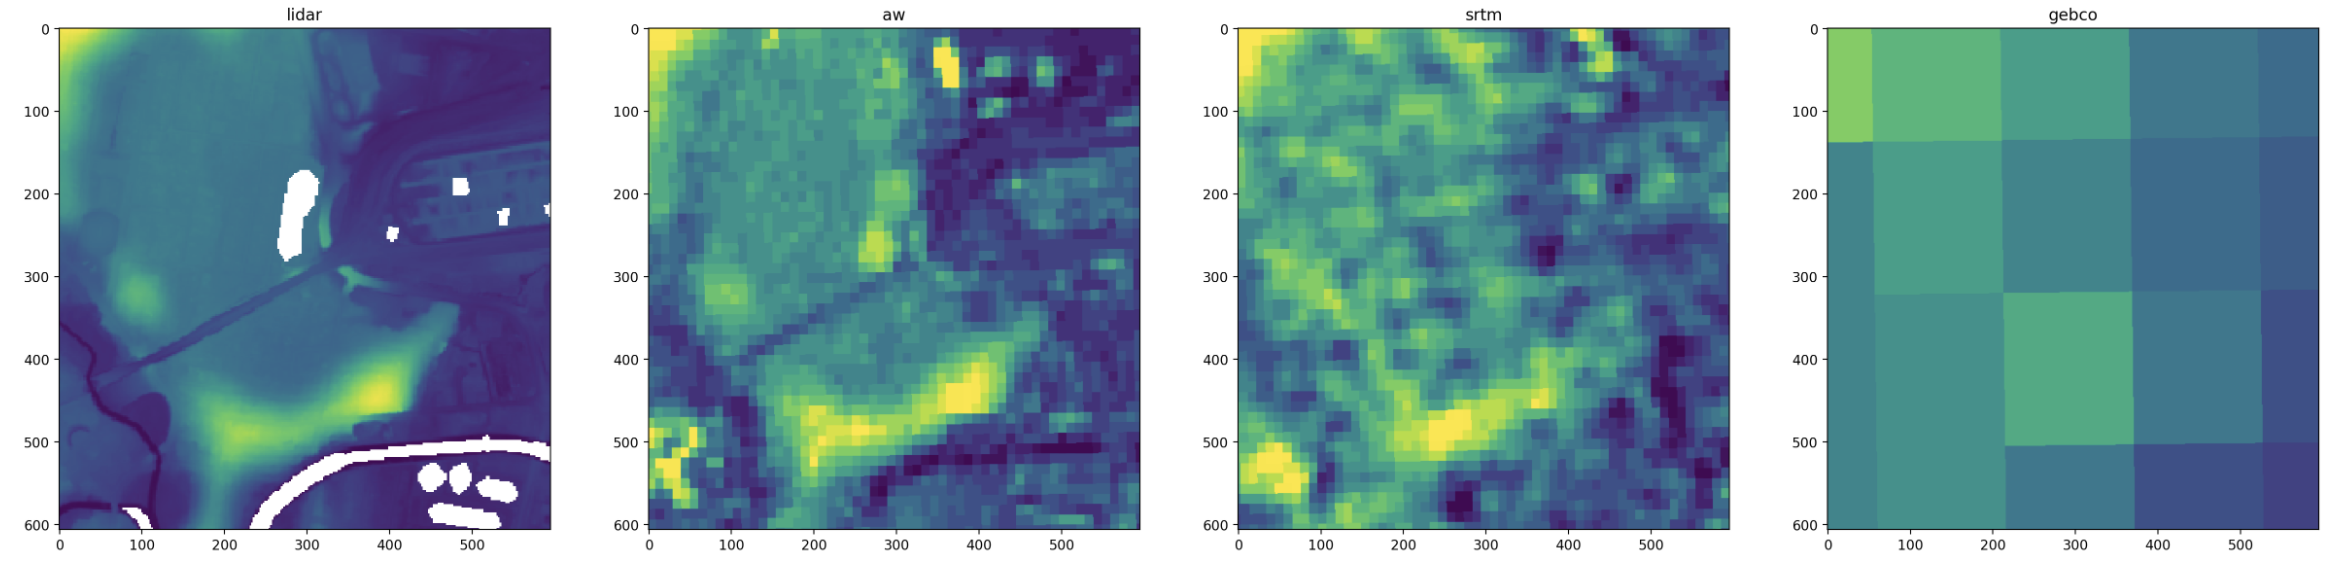
A second approach is to transform the bounds into the coordinate system of each raster, then read a rectangular window from each one.
This preserves the true pixel data as you’re just reading a subset of the raster array. The downside is that the extent of each array is rounded to the resolution and rotation of each dataset, so they don’t line up exactly.
Here’s the code I use:
def load_cropped_raster(path, bounds, bounds_epsg=WGS84_LATLON_EPSG):

    with rasterio.open(path) as f:

            # Transform bounds to raster.
            bounds = rasterio.warp.transform_bounds(
                {'init': f'epsg:{bounds_epsg}'},
                f.crs,
                *bounds
            )
        window = rasterio.windows.from_bounds(*bounds, f.transform)
        a = f.read(1, masked=True, out_dtype=float, window=window)
        a = np.ma.filled(a, np.nan)

    return a


# Make bounds with functions from gpxz.io/blog/aligning-rasters-for-analysis.
centre_lat = -32.903
centre_lon = 151.752
size_m = 30*100
bounds = radius_bounds(centre_lat, centre_lon, size_m)

# Paths.
lidar_path = '~/gpxz-dataset/data/audem.vrt'
srtm_path = '~/gpxz-dataset/data/srtm30m.vrt'
gebco_path = '~/gpxz-dataset/data/gebc2020.vrt'

# Load cropped arrays.
ac_lidar = load_cropped_raster(lidar_path, bounds)
ac_aw = load_cropped_raster(aw_path, bounds)
ac_srtm = load_cropped_raster(srtm_path, bounds)
ac_gebco = load_cropped_raster(gebco_path, bounds)