Loading a .gpx file into a Pandas DataFrame
I like to do analysis in a Pandas DataFrame for its fast vectorised operations and convenient statistical functions. Luckily, it’s pretty easy to use Pandas to work with .gpx activity files.
Loading a GPX file into a DataFrame
For this demo I’m using the run.gpx sample file from Mapbox and the gpxpy parsing library.
import gpxpy
import pandas as pd

# Load gpx.
gpx_path = 'run.gpx'
with open(gpx_path) as f:
    gpx = gpxpy.parse(f)

# Convert to a dataframe one point at a time.
points = []
for segment in gpx.tracks[0].segments:
    for p in segment.points:
        points.append({
            'time': p.time,
            'latitude': p.latitude,
            'longitude': p.longitude,
            'elevation': p.elevation,
        })
df = pd.DataFrame.from_records(points)

Most GPX files I see in the wild have a single track, but you may need to modify this for multiple tracks.
Adding distance and timing
Most analysis of GPX files involves either the time or distance component. Pandas make it easy to calculate attributes like cumulative distance and time.
import geopy.distance


# Cumulative distance.
coords = [(p.latitude, p.longitude) for p in df.itertuples()]
df['distance'] = [0] + [geopy.distance.distance(from_, to).m for from_, to in zip(coords[:-1], coords[1:])]
df['cumulative_distance'] = df.distance.cumsum()


# Timing.
df['duration'] = df.time.diff().dt.total_seconds().fillna(0)
df['cumulative_duration'] = df.duration.cumsum()
df['pace_metric'] = pd.Series((df.duration / 60) / (df.distance / 1000)).bfill()
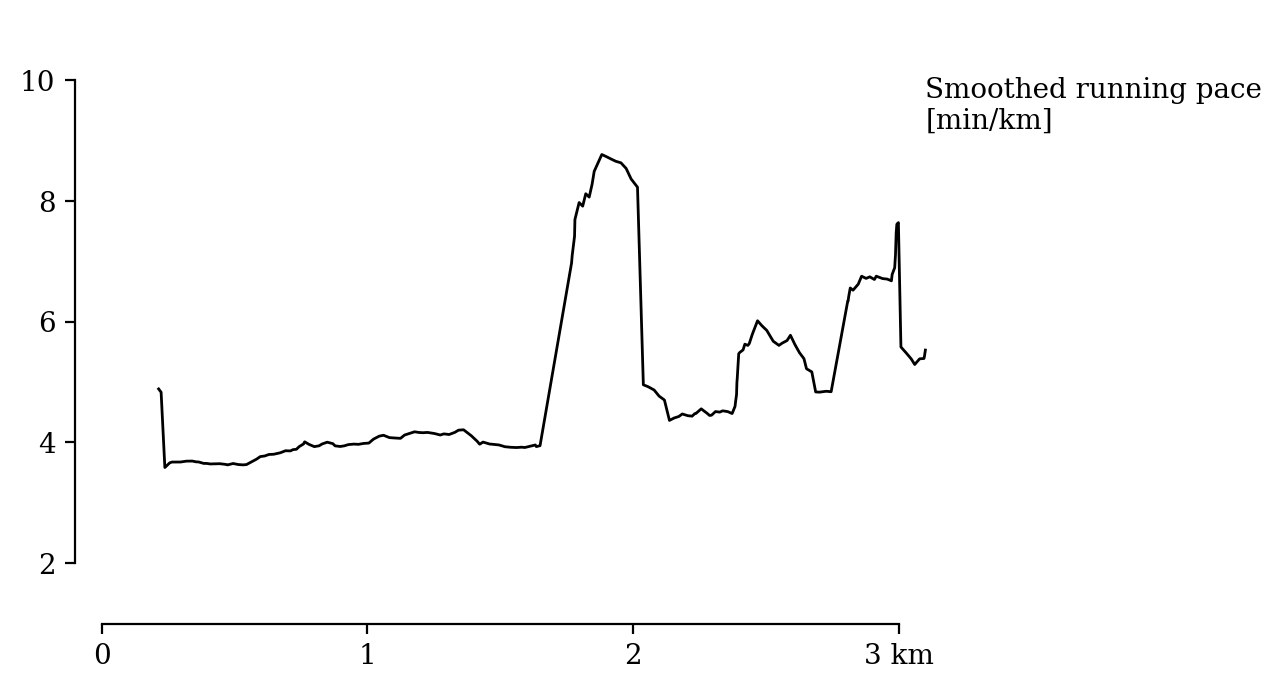
Now we can plot smoothed pace over time
from numpy_ext import rolling_apply
import matplotlib.pyplot as plt


def rolling_metric_pace(duration, distance):
    return (duration.sum() / 60) / (distance.sum() / 1000)


x = df.cumulative_distance
y = rolling_apply(rolling_metric_pace, 10, df.duration.values, df.distance.values)

plt.plot(x, y)
Adding elevation to GPX data
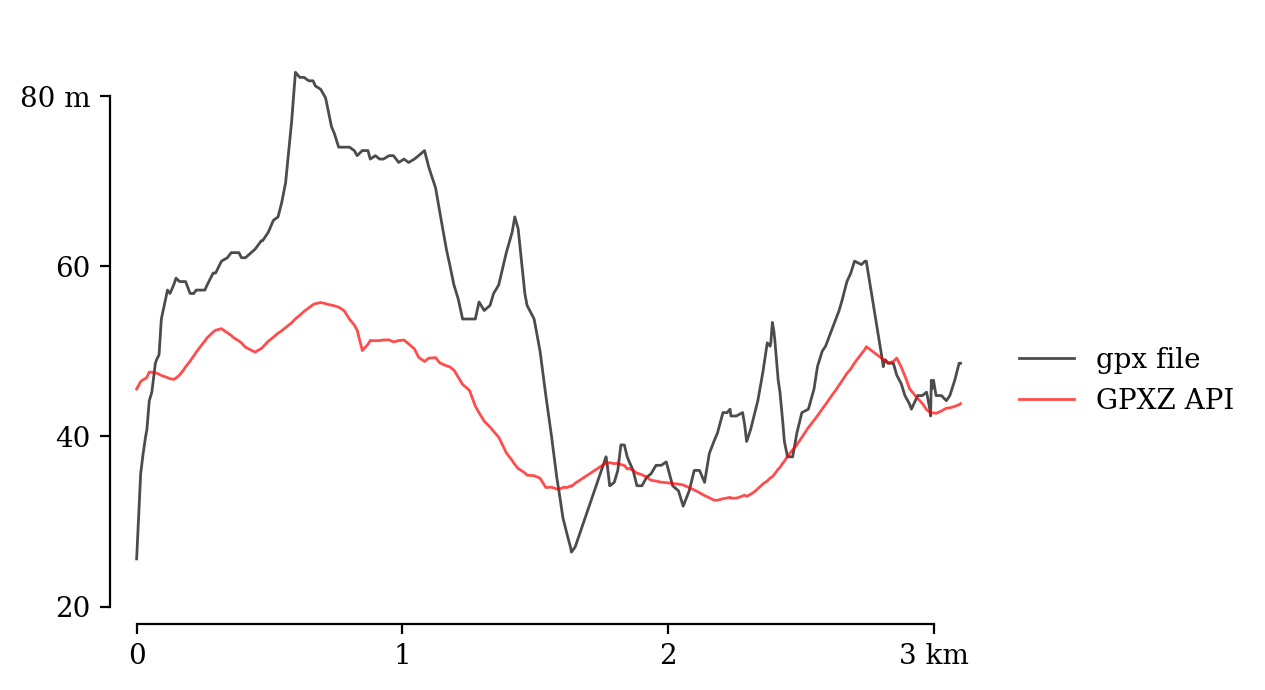
Some GPX files come without elevation data, and even when high information is included it is often of poor quality (as only low-resolution datasets can be included in sports tracking devices).
We can use the GPXZ API to add elevation data to our DataFrame. You’ll need to grab a free API key from over at gpxz.io:
import numpy as np
import requests


API_KEY = 'ak_demo_1234'
BATCH_SIZE = 50  # 512 for paid customers.


def gpxz_elevation(lats, lons):
	'''Iterate over the coordinates in chunks, querying the GPXZ api to return
	a list of elevations in the same order.'''
	elevations = []
    n_chunks = int(len(lats) // BATCH_SIZE)  + 1
    lat_chunks = np.array_split(lats, n_chunks)
    lon_chunks = np.array_split(lons, n_chunks)
    for lat_chunk, lon_chunk in zip(lat_chunks, lon_chunks):
        latlons = '|'.join(f'{lat},{lon}' for lat, lon in zip(lat_chunk, lon_chunk))
        data = {
            'latlons': latlons,
        }
        response = requests.post(
            'https://api.gpxz.io/v1/elevation/points',
            headers={'x-api-key': API_KEY},
            data=data,
        )
        response.raise_for_status()
        elevations += [r['elevation'] for r in response.json()['results']]
    return elevations

df['elevation_gpxz'] = gpxz_elevation(df.latitude, df.longitude)
The GPXZ data is smoother and less noisy.
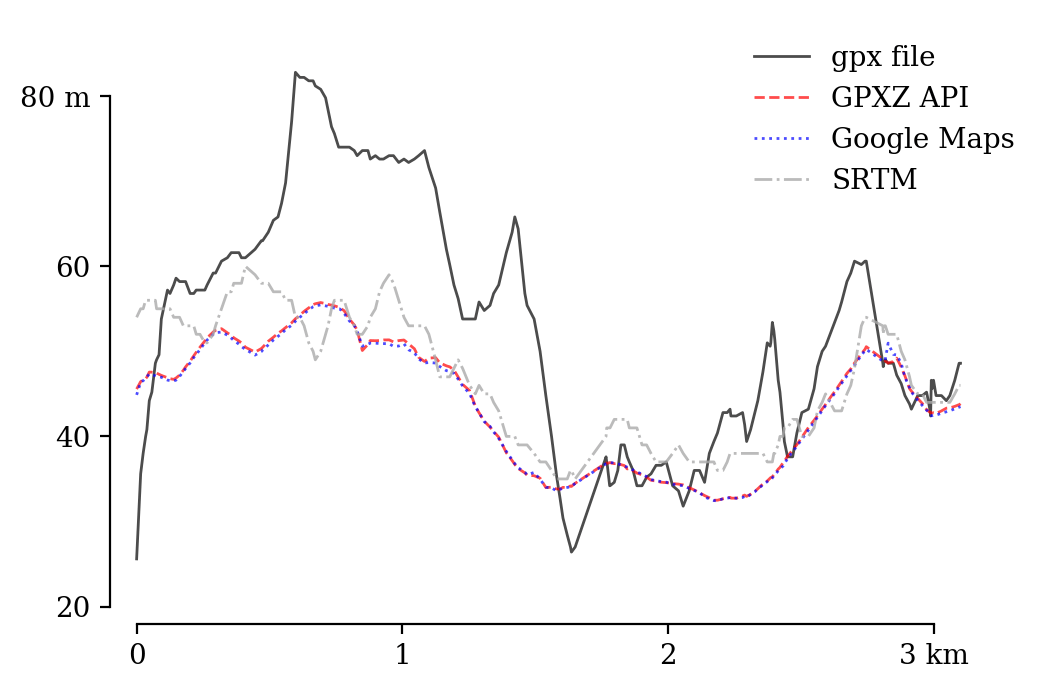
The GPXZ elevation profile is very close to elevation data from the Google Maps API, with SRTM 30m data shown here for comparison too.
Elevation data for training apps
GPXZ is an API for elevation data: we make it easy to generate analysis-ready elevation profiles in applications serving weekend warriors and professional athletes.
If you need help processing or analysing GPX files or activity data, please get in touch [email protected]