Calculating elevation-adjusted calorie burn in Python
How elevation change impacts energy expenditure
Many online calorie calculators ignore elevation entirely. For small grades (< 2%) over looped runs/hikes this can be an acceptable simplification: the extra effort spent at a mild grade is similar to the energy saved descending a mild grade, and if you start and finish at the same elevation this will roughly cancel out.
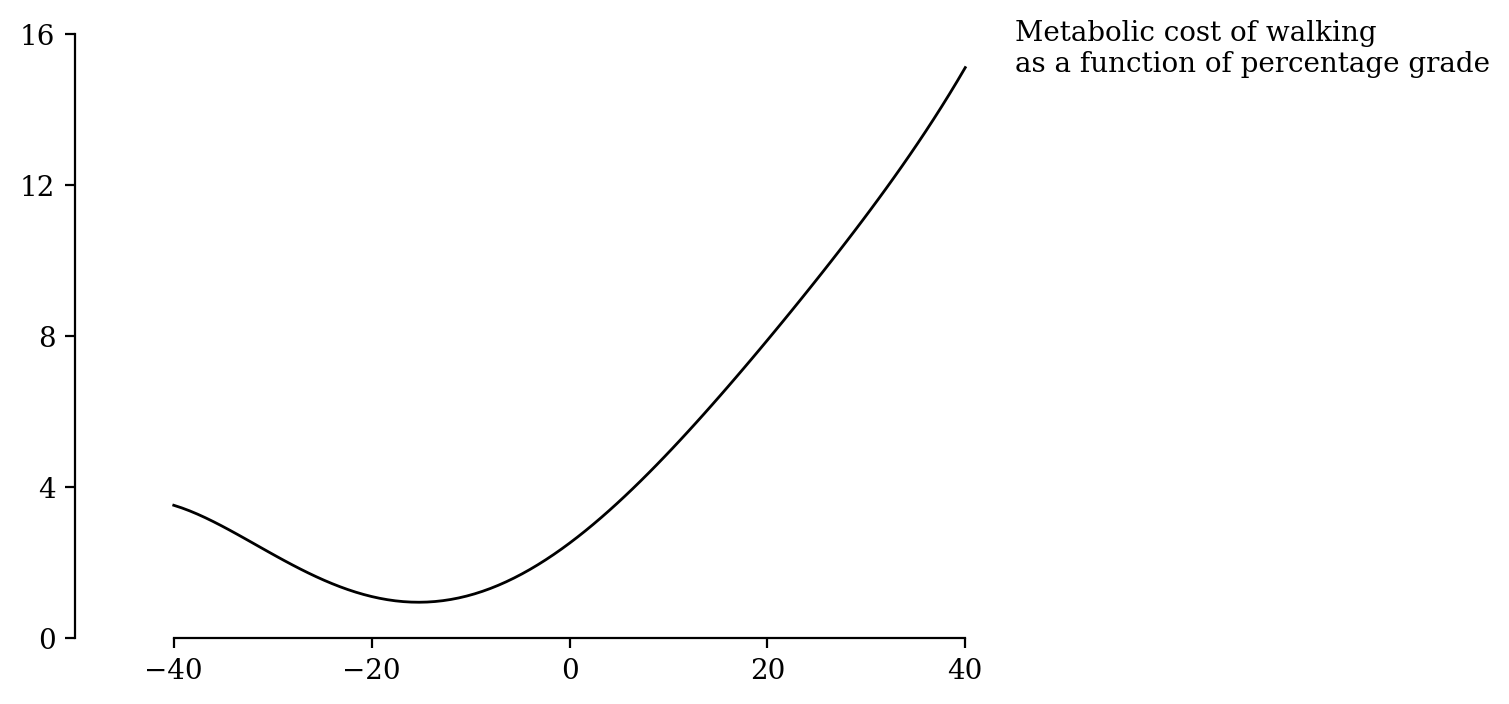
But for the increased steepness commonly encountered hiking this balance breaks down. In fact, descending very steep slopes uses more energy than covering the same distance over flat ground. Researchers call this a J-shaped curve. For example, Minetti et al. (2002) measured the shape
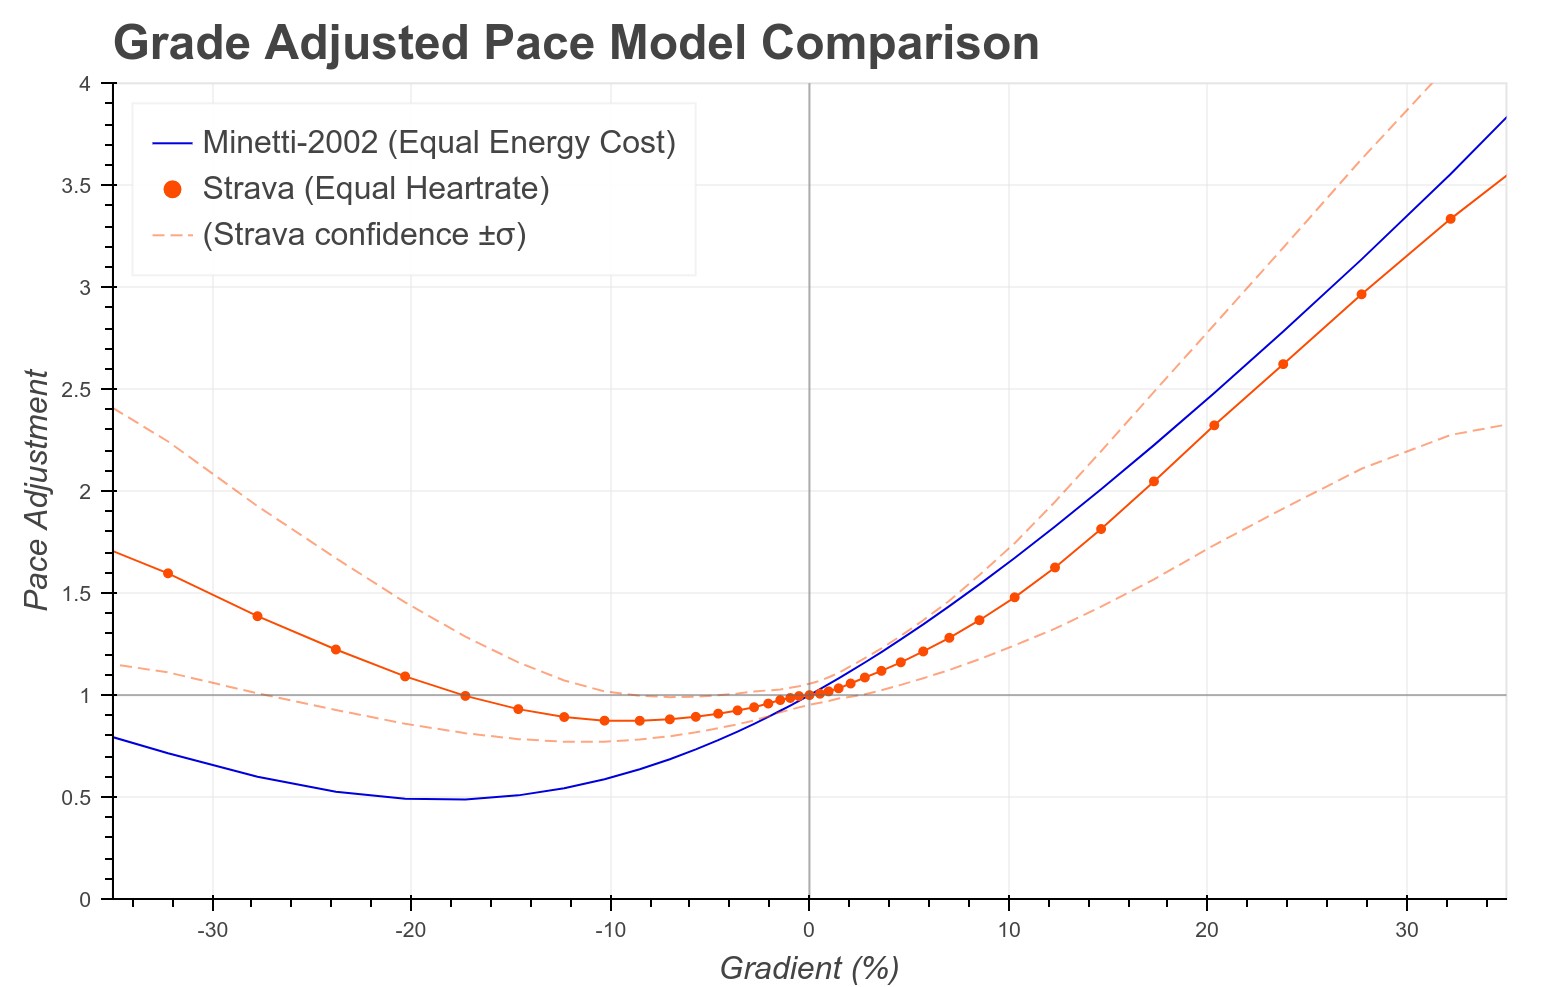
and a similar curve is used by Strava in their Grade Adjusted Pace:
So an accuracy energy expenditure figure must take grade into account.
How speed impacts hiking calorie burn
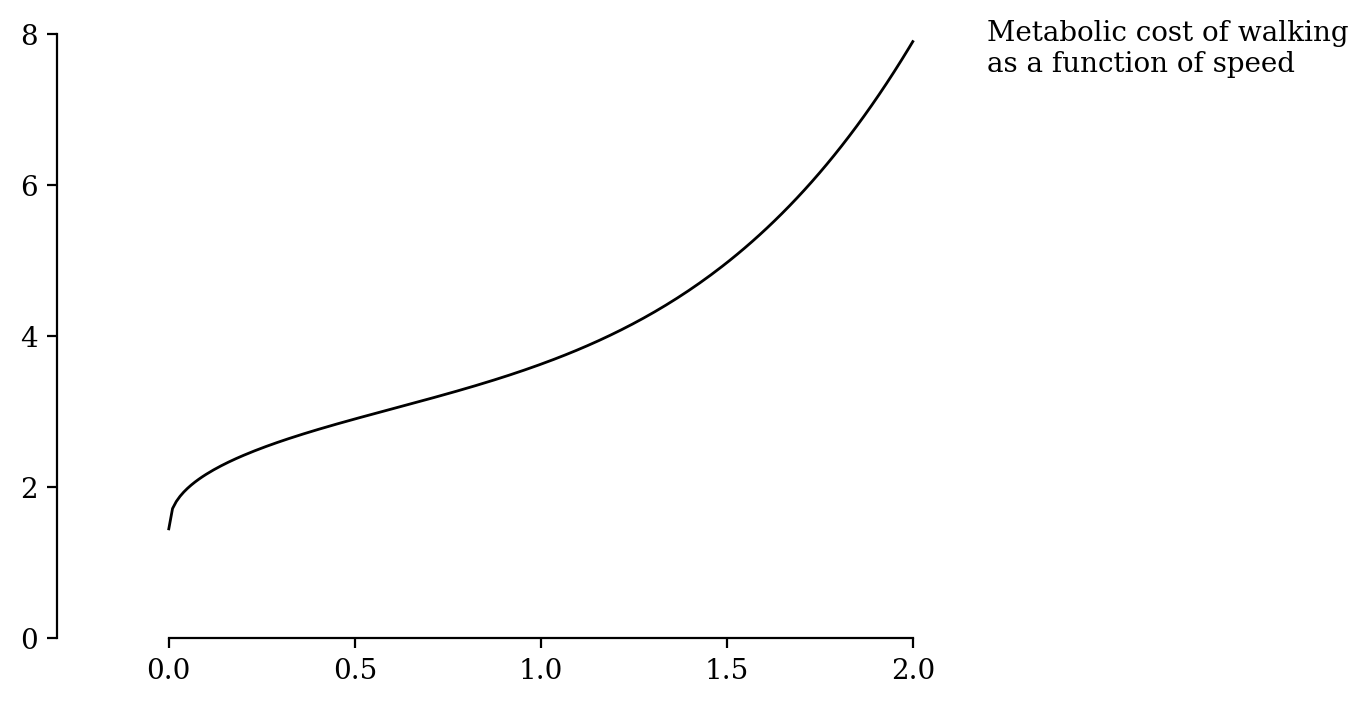
Walking speed also has a non-linear relationship with energy expenditure. In a meta-analysis of other research, Looney et al. (2020) use the formula
Energy expenditure = 1.44 + 1.94 * speed0.43 + 0.24 * speed4
which accounts for standing metabolic rate, and increasing biomechanical inefficiency at high speeds.
Putting it all together
The final equation from Looney et al. (2020) looks like this:
s = speed [m s-1]
g = grade [rise / run * 100]
EE = Energy expenditure [J kg-1 s-1]

EE = 1.44 + 1.94s0.43 + 0.2s4 + 0.35sg(1 - 1.051 - 1.1g + 32)
To convert EE to calorie burn for a segment at constant speed and grade:
m = Hiker mass [kg]
t = Time [s]
C = Calorie burn [food calorie]

C = EE * m * t / 4184
Calculating calorie burn in Python from a .gpx file
With that all figured out, we can calculate the calorie burn using python.
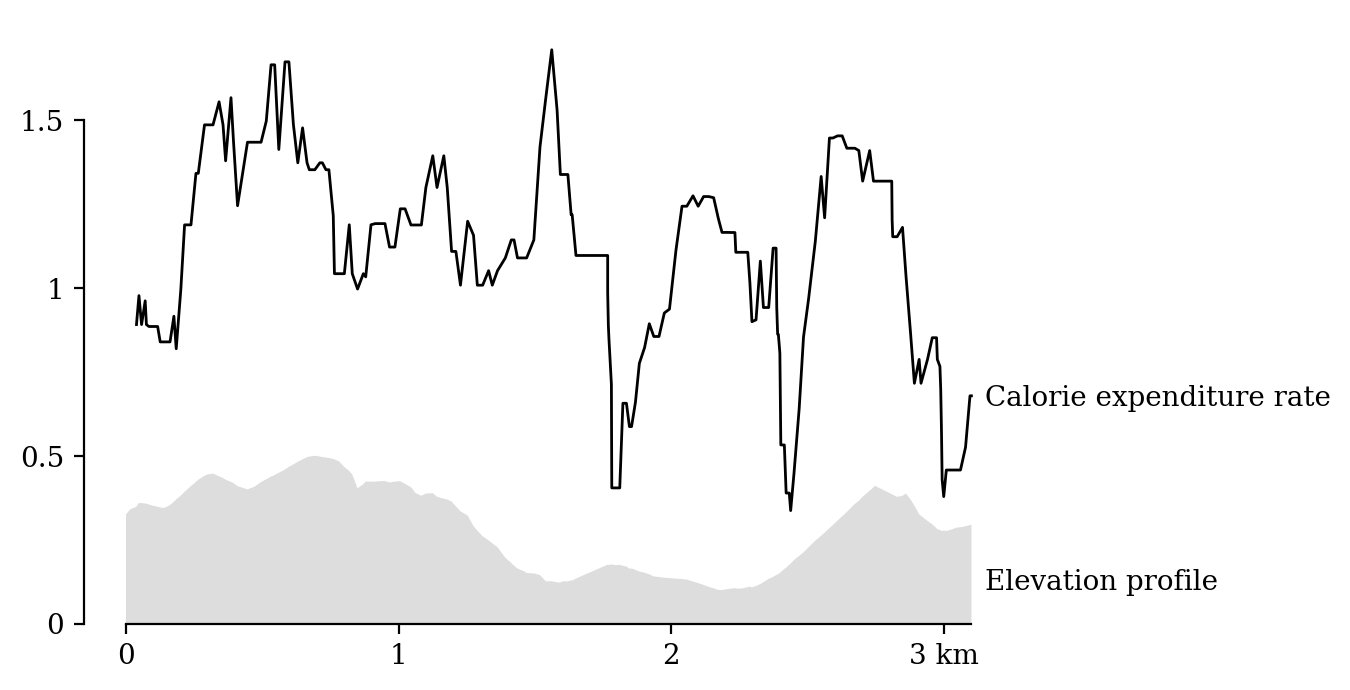
We’ll assume we have a .gpx file of a hiking activity, which records location at uneven time intervals. We’ll figure out the distance and height gain of each interval, then apply the above equation to get the calorie usage of each interval. This can be summed together for a total energy usage, or plotted Strava-style with an elevation profile.
First, load the GPX file into python. Pandas will make it easy to keep track of the various segment variables. For this demo, I’m using the run.gpx sample file from Mapbox and halving the speed to approximate a hike rather than the provided run.
import gpxpy
import pandas as pd
import geopy.distance


# Load gpx.
gpx_path = 'run.gpx'
with open(gpx_path) as f:
    gpx = gpxpy.parse(f)

# Convert to a dataframe one point at a time.
points = []
for segment in gpx.tracks[0].segments:
    for p in segment.points:
        points.append({
            'time': p.time,
            'latitude': p.latitude,
            'longitude': p.longitude,
            'elevation': p.elevation,
        })
df = pd.DataFrame.from_records(points)

# Timing and distance for each segment.
coords = [(p.latitude, p.longitude) for p in df.itertuples()]
df['distance'] = [0] + [geopy.distance.distance(from_, to).m for from_, to in zip(coords[:-1], coords[1:])]
df['duration'] = df.time.diff().dt.total_seconds().fillna(0) * 2
.gpx files often contain low-resolution elevation data, or are missing elevation data altogether. So next up, use GPXZ to add hi-resolution elevation data. This needs a free API key from at gpxz.io.
import numpy as np
import requests


API_KEY = 'ak_demo_1234'
BATCH_SIZE = 50  # 512 for paid customers.


def gpxz_elevation(lats, lons):
    '''Iterate over the coordinates in chunks, querying the GPXZ api to return
    a list of elevations in the same order.'''
    elevations = []
    n_chunks = int(len(lats) // BATCH_SIZE)  + 1
    lat_chunks = np.array_split(lats, n_chunks)
    lon_chunks = np.array_split(lons, n_chunks)
    for lat_chunk, lon_chunk in zip(lat_chunks, lon_chunks):
        latlons = '|'.join(f'{lat},{lon}' for lat, lon in zip(lat_chunk, lon_chunk))
        data = {
            'latlons': latlons,
        }
        response = requests.post(
            'https://api.gpxz.io/v1/elevation/points',
            headers={'x-api-key': API_KEY},
            data=data,
        )
        response.raise_for_status()
        elevations += [r['elevation'] for r in response.json()['results']]
    return elevations

df['elevation_gpxz'] = gpxz_elevation(df.latitude, df.longitude)
Now the calorie burn of each segment can be calculated
# Speed and grade.
s = (df.distance / df.duration).fillna(0)
g = (df.rise / df.distance).fillna(0) * 100

# Energy expenditure
EE = 1.44
EE += 1.94 * s ** 0.43
EE += 0.24 * s ** 4
EE += 0.34 * s * g * (1 - 1.05 ** (1 - 1.1 ** (g + 32)))

# Calorie conversion.
joules_in_food_calorie = 4184
mass = 75  # kg

# Calories.
C = EE * mass * df.duration / joules_in_food_calorie


# Total calories
print(C.sum())
# 248.95040869913055
The total calorie burn is 250 kCal, which seems about right for a 3km walk.
Hopefully this is enough to get you started! As for next steps, there’s a few more things that need to be considered before taking a calorie calculator like this to production
- Different activities (running, cycling, etc.) have different energy expenditure formulas.
- .gpx files can contain very short segments and errors than can blow up non-linear formulas like this. In reality, you’ll probably want to filter out any small segments (distance- and time-wise), cap speeds and slopes to realistic or smoothed values, and smooth any visualisations.